Partial Stroke Test Diagnostics for High Pressure Automated Shutoff Valves
Partial stroke testing validates emergency shutdown valve availability by measuring dynamic torque and pressure response during limited stem travel.


Thrust
High differential pressures across automated shutdown valves create heavy friction along the stem packing and seat rings during initial breakaway. Holding an emergency shutdown valve open for months or years under continuous line pressure forces the closure element hard against downstream seating surfaces, driving up mechanical breakout force over time. Partial stroke testing verifies that the actuator can deliver enough energy to unseat the stem without moving the valve far enough to upset header flow or process stability.
A ten percent stem stroke confirms mechanical integrity while staying well within allowable flow limits on the production header.

Force Balance across High Pressure Seats
Differential pressure pushing a floating ball or plug against its downstream seat ring creates mechanical resistance that the actuator must overcome before the stem moves at all. Total breakaway force is the sum of static seat friction, packing compression, seal drag, and fluid dynamic shear. In high-pressure service above 100 bar, seat friction dominates this balance.
Once the stem breaks free and moves, dynamic friction drops, producing a distinct force peak at breakaway.
Seat friction builds quickly under differential pressure. As cylinder pressure shifts the piston, actuator force overrides this static resistance, and movement begins as soon as binding is overcome.
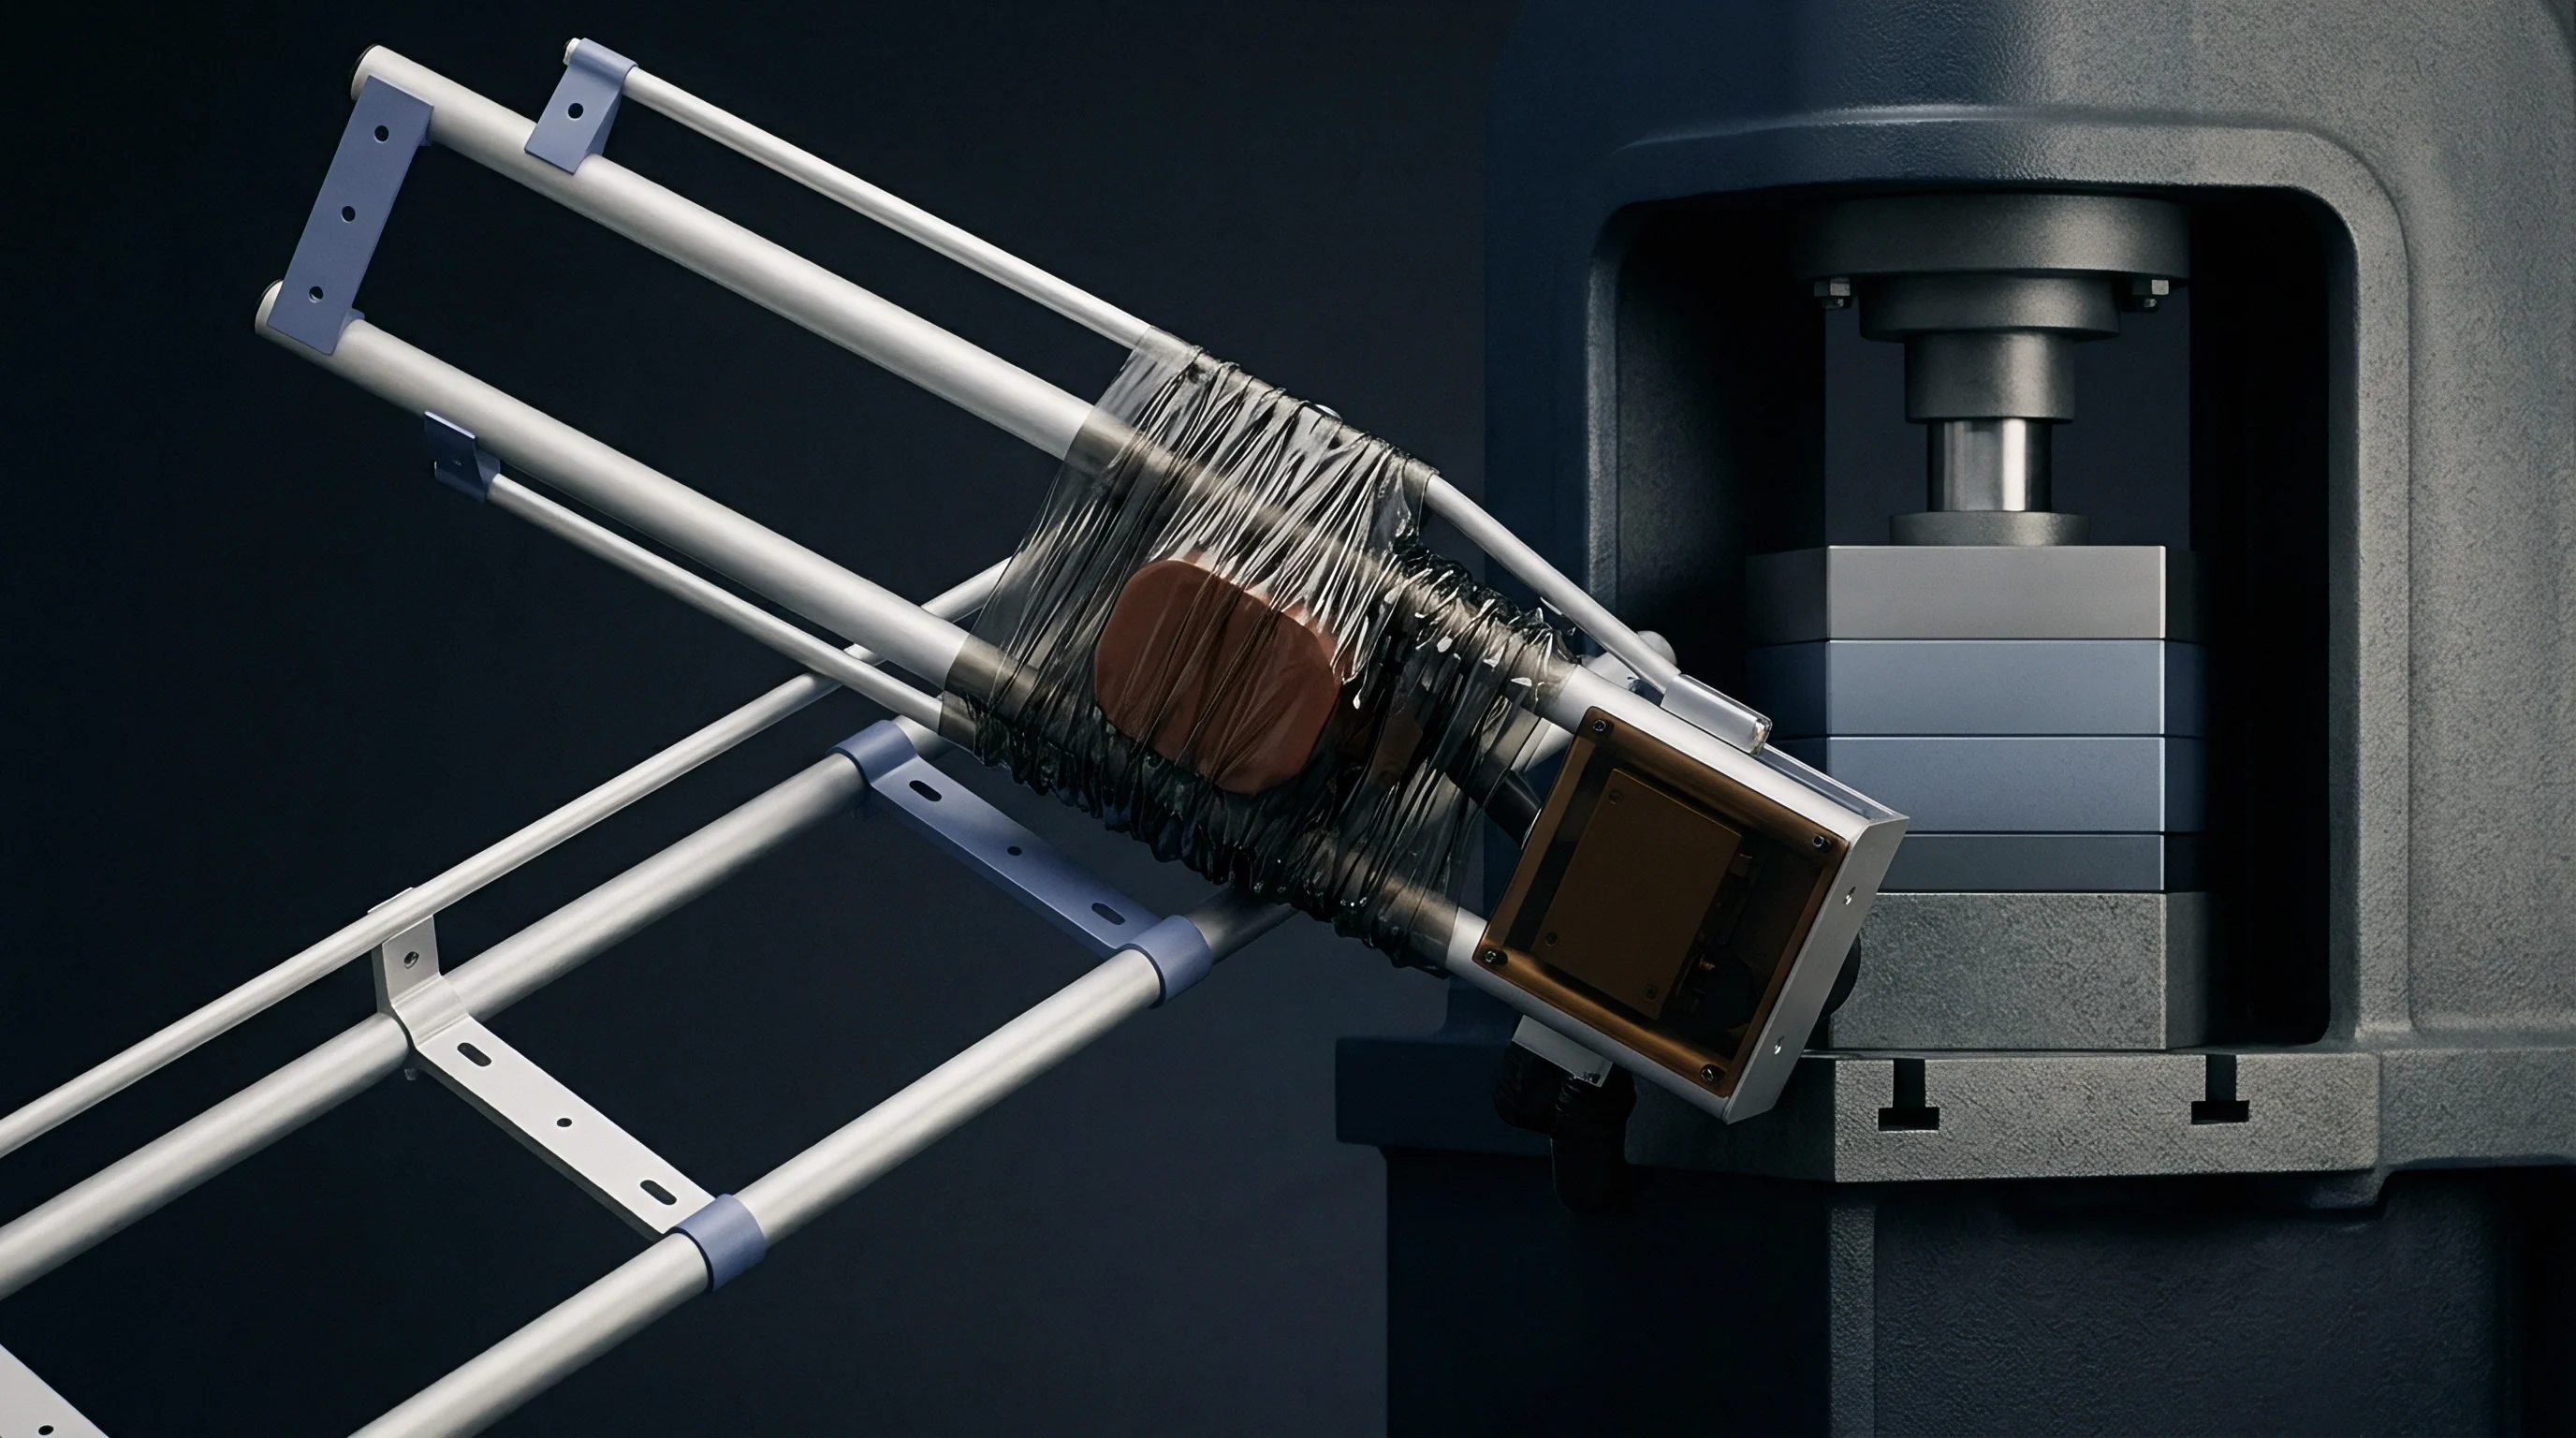
Single-acting spring-return actuators rely on compressed coil springs to shut the valve if power or air supply fails. In the open position, pneumatic pressure holds these springs compressed. Running a partial stroke diagnostic means venting just enough air from the cylinder to let spring force nudge the stem toward the closed position.
Actuator Reserve Margin and Breakout Dynamics
Supply air delivers force well beyond the static friction threshold, giving the actuator its reserve margin. High differential pressure erodes this margin by increasing seat loads. If line pressure climbs past design baselines or maintenance over-torques the packing gland, net available force can fall below safe limits.
Sensors pick up minor stem jumps while pressure decay curves show if mechanical resistance aligns with baseline calculations. By recording supply pressure drops alongside stem displacement, smart positioners calculate breakout force metrics in real time.
| Diagnostic Vector | Physical Force Component | Sensor Hardware | Nominal Signal Range |
|---|---|---|---|
| Breakout Torque | Static seat and packing friction | Differential pressure transmitter | 15 to 35 percent supply drop |
| Dynamic Drag | Sliding stem and guide friction | Hall-effect stem travel encoder | 2 to 8 percent travel span |
| Spring Rate Balance | Actuator return spring force | Pneumatic cylinder pressure transducer | 0.2 to 0.5 bar per millimeter |
| Exhaust Velocity | Pilot solenoid venting friction | Exhaust port pressure sensor | 50 to 120 milliseconds response |
Smooth valve movement during ambient testing does not guarantee reliable emergency closure under full dynamic differential pressure.


Signature
Digital valve controllers plot continuous drive signals against stem position to generate repeatable diagnostic profiles during each test. These signatures map actuator pressure directly to stem displacement. Comparing a new profile against factory calibration curves reveals mechanical changes inside the valve long before the assembly actually seizes.
A stiction value exceeding four percent of total bench range points to severe packing contamination under a 100 bar differential pressure.

Pressure Travel Diagnostics and Differential Waveforms
Plotting actuator pressure against stem travel shows the exact energy consumed during valve movement. The upper trace of the pressure-travel loop tracks the pressure needed to move the stem while venting, and the lower trace tracks pressure during re-pressurization. The vertical spread between them measures total mechanical hysteresis and friction in the actuator and valve body.
Uncontrolled stiction causes jerky movement during partial travel tests. As stem packing degrades or process deposits build up on sliding surfaces, friction increases transit times and expands the area inside the pressure-travel hysteresis loop.
Digital positioners track dynamic pressure drops across internal relays throughout the test. A sudden shift in the curve’s slope marks mechanical binding or interference at specific points along the stem stroke.

Transient Waveform Analysis in Smart Positioners
Piezoelectric pressure transducers paired with optical stem encoders record pressure drops at five millisecond sampling intervals. Onboard microprocessors run fast Fourier transforms on pressure decay signals to distinguish high-frequency mechanical vibration from normal stem travel. Spikes in acoustic energy point to internal stem galling or particulate buildup inside guide bushings.
| Diagnostic Metric | Deviation Profile | Underlying Mechanical Defect | Detection Threshold |
|---|---|---|---|
| Breakout Delay | Extended pressure drop prior to motion | High static packing stiction | Greater than 500 milliseconds |
| Travel Hysteresis | Expanded area between stroke curves | Internal stem guide galling | Exceeding 5 percent of stroke pressure |
| Pressure Plateau | Flat pressure line during movement | Actuator spring coil binding | Flatline span over 2 percent travel |
| Overshoot Spike | Travel position exceeds target limit | Inadequate pneumatic damping balance | Over 3 percent past target endpoint |
Analyzing transient response times during pulse testing confirms both coil health and clear exhaust pathways. When the digital controller pulses the emergency solenoid valve for twenty milliseconds, pressure drops momentarily in the actuator chamber without moving the main stem. Measuring the size of this pressure pulse validates solenoid mechanics online without risking process trips.
Dismissing transient pressure spikes as simple pneumatic noise can lead directly to unexpected stem seizure during an actual plant trip.


Degradation
Automated valve assemblies in sour gas or high-pressure hydrocarbon service wear down over time from static binding, chemical scaling, and atmospheric corrosion. Packing tightens under thermal cycling and routine gland adjustments, driving up friction. Meanwhile, seat surfaces exposed to dirty fluids collect debris, increasing the torque required to turn a ball valve or unseat a globe plug.

What Dynamic Limits Prevent False Trips during Partial Stroke Testing?
Setting tight position tolerances keeps the stem from overshooting into positions that choke process flow. Smart positioners abort testing automatically if travel speeds exceed velocity limits or pressure drops cross pre-set thresholds.
A gradual rise in breakaway torque across consecutive test cycles signals impending seizure long before the valve locks up completely.
Mechanical wear affects multiple components inside automated shutoff valve assemblies concurrently:
- Packing binding friction increases static breakout force requirements until pneumatic pressure surges trigger uncontrolled stem jump.
- Solenoid exhaust restriction retards depressurization rates, extending valve response time beyond process safety limits.
- Actuator spring relaxation alters force output across the stroke, reducing available torque at the seat-touch point.
- Stem galling damage produces sharp pressure spikes in diagnostic curves as torn metal surfaces scrape guide bushings.
Particulate contamination in pneumatic supply lines can cause spool valves to stick or leak continuously. Similarly, dirt in pilot solenoid exhaust ports slows depressurization during emergency trips. Partial stroke testing catches restricted venting by tracking changes in the pressure decay slope during transient air releases.
Hydraulic dampers attached to heavy valves can leak fluid over extended operation, losing mechanical cushioning and increasing impact stress when the valve slams shut.
Comparing test results against original baselines catches mechanical binding early, whereas isolated readings hide ongoing wear trends.


Interval
Safety instrumented systems rely on probability calculations to verify that emergency valves open or close within mandated risk reduction targets. High-pressure shutoff valves act as the final element in safety loops protecting refineries, offshore platforms, and chemical plants. If a final element fails to close on demand, process safety exposure rises dramatically, making regular performance verification a strict regulatory requirement.
IEC 61511 clause 11.8.2 requires that diagnostic tests with automatic aborts preserve process safety without triggering unnecessary unit trips.

PFDavg Calculation and Proof Test Coverage Factor
Factoring automated partial testing into safety function models splits the dangerous undetected failure rate into tested and untested fractions. A full stroke proof test detects virtually all dangerous undetected mechanical failures, yielding a coverage factor near 100 percent. However, full stroke testing requires a full plant shutdown or complex bypass arrangements that carry human error risks.
Partial stroke testing achieves a proof coverage factor between 60 percent and 70 percent while the unit operates at full load. Running automated tests at short intervals lowers the average probability of failure on demand without the cost of a shutdown.

Worked Calculation of Safety Integrity Level Extension
A mathematical example shows how proof test coverage alters the overall probability of dangerous failure on demand for an emergency shutdown valve. Consider an isolation loop with a base dangerous undetected failure rate of 1.2 times 10 to the power of negative six per hour, or 0.0105 failures per year.
Without partial stroke testing, running a full offline proof test once every 8,760 hours (one year) yields the following average failure probability:
PFDavg = 0.5 (1.2 10^-6) 8760 = 5.25 10^-3
This value satisfies basic Safety Integrity Level 2 criteria. Extending the full offline test interval to 26,280 hours (three years) without intermediate testing pushes the failure probability to 1.58 times 10 to the power of negative two, dropping loop reliability below SIL 2 minimums.
Adding automated monthly partial stroke testing at 720-hour intervals with a validated 65 percent proof test coverage factor modifies the calculation:
PFDavg = 0.5 C_PST lambda_D T_PST + 0.5 (1 – C_PST) lambda_D T_1
PFDavg = 0.5 0.65 (1.2 10^-6) 720 + 0.5 0.35 (1.2 10^-6) 26280
PFDavg = 0.0001404 + 0.0055188 = 5.66 10^-3
Implementing monthly diagnostic testing enables engineers to triple full offline maintenance intervals while still meeting loop integrity targets.
Field teams execute safety instrumented loop optimization following a systematic validation sequence:
- Determine base dangerous undetected failure rates from published reliability databases or field operating records.
- Assign conservative proof test coverage factors validated by diagnostic coverage testing for specific positioner models.
- Calculate partial stroke testing intervals needed to keep total dangerous failure probability below safety targets.
- Configure position travel limits and pressure cutoffs inside controller firmware to initiate automatic abort sequences.
Standard ANSI/ISA 84.00.01 section 11.4 restricts maximum proof test coverage credit to certified mechanical components, preventing operators from claiming digital positioner self-diagnostics as full valve integrity.


Payback
Installing diagnostic hardware on high-pressure automated valves requires capital outlay for smart positioners, high-flow air volume boosters, and dedicated safety network drops. Digital valve controllers, pressure sensors, and mounting hardware add between 3,000 and 7,000 USD in upfront costs per assembly over simple limit switch setups. Integrating these instruments into plant asset management software also requires programming labor and infrastructure investment.

Capital Outlay versus Avoided Shutdown Expenditure
Relying on conventional proof testing forces operators to shut down production trains every twelve to eighteen months just to stroke emergency isolation valves. On a major gas processing asset, an unscheduled or turnaround-driven outage costs between 200,000 and 1,500,000 USD per day in lost throughput and flaring. Deferring turnaround cycles from two years to four through online partial stroke testing saves millions in direct operating expenditure.
Asset managers evaluate diagnostic investments by comparing total capital outlay against avoided operational expenditure over a ten-year facility lifecycle.

Visibility Investment and Commercial Return
Calculating financial returns from valve diagnostic automation involves weighing hardware costs against extended production runs. Smart positioners track wear trends continuously, turning unpredictable mechanical failures into preventive maintenance planned around scheduled outages.
| Operating Parameter | Conventional Full Proof Testing | Automated Partial Stroke Testing | Combined Diagnostic Integration |
|---|---|---|---|
| Initial Hardware Cost per Valve | 2,500 USD | 7,500 USD | 11,000 USD |
| Annual Maintenance Labor | 1,200 USD | 400 USD | 300 USD |
| Required Offline Outage Frequency | 12 to 18 Months | 36 to 48 Months | 48 to 60 Months |
| Spurious Trip Risk Exposure | High during bypass operations | Very Low with automatic aborts | Minimal with redundant logic |
| Ten-Year Net Present Value Impact | Baseline reference | +450,000 USD per valve loop | +620,000 USD per valve loop |
Diagnostic data streams feed asset health software, triggering early warning alerts when breakaway torque crosses pre-set friction thresholds. Early detection prevents catastrophic valve seizures, protecting production assets and optimizing long-term maintenance budgets.
Whether insurance underwriters will eventually offer lower premiums for facilities maintaining continuous PST telemetry across primary isolation loops remains an open commercial question in heavy industrial risk management.